How it works
Consumption vs Supply
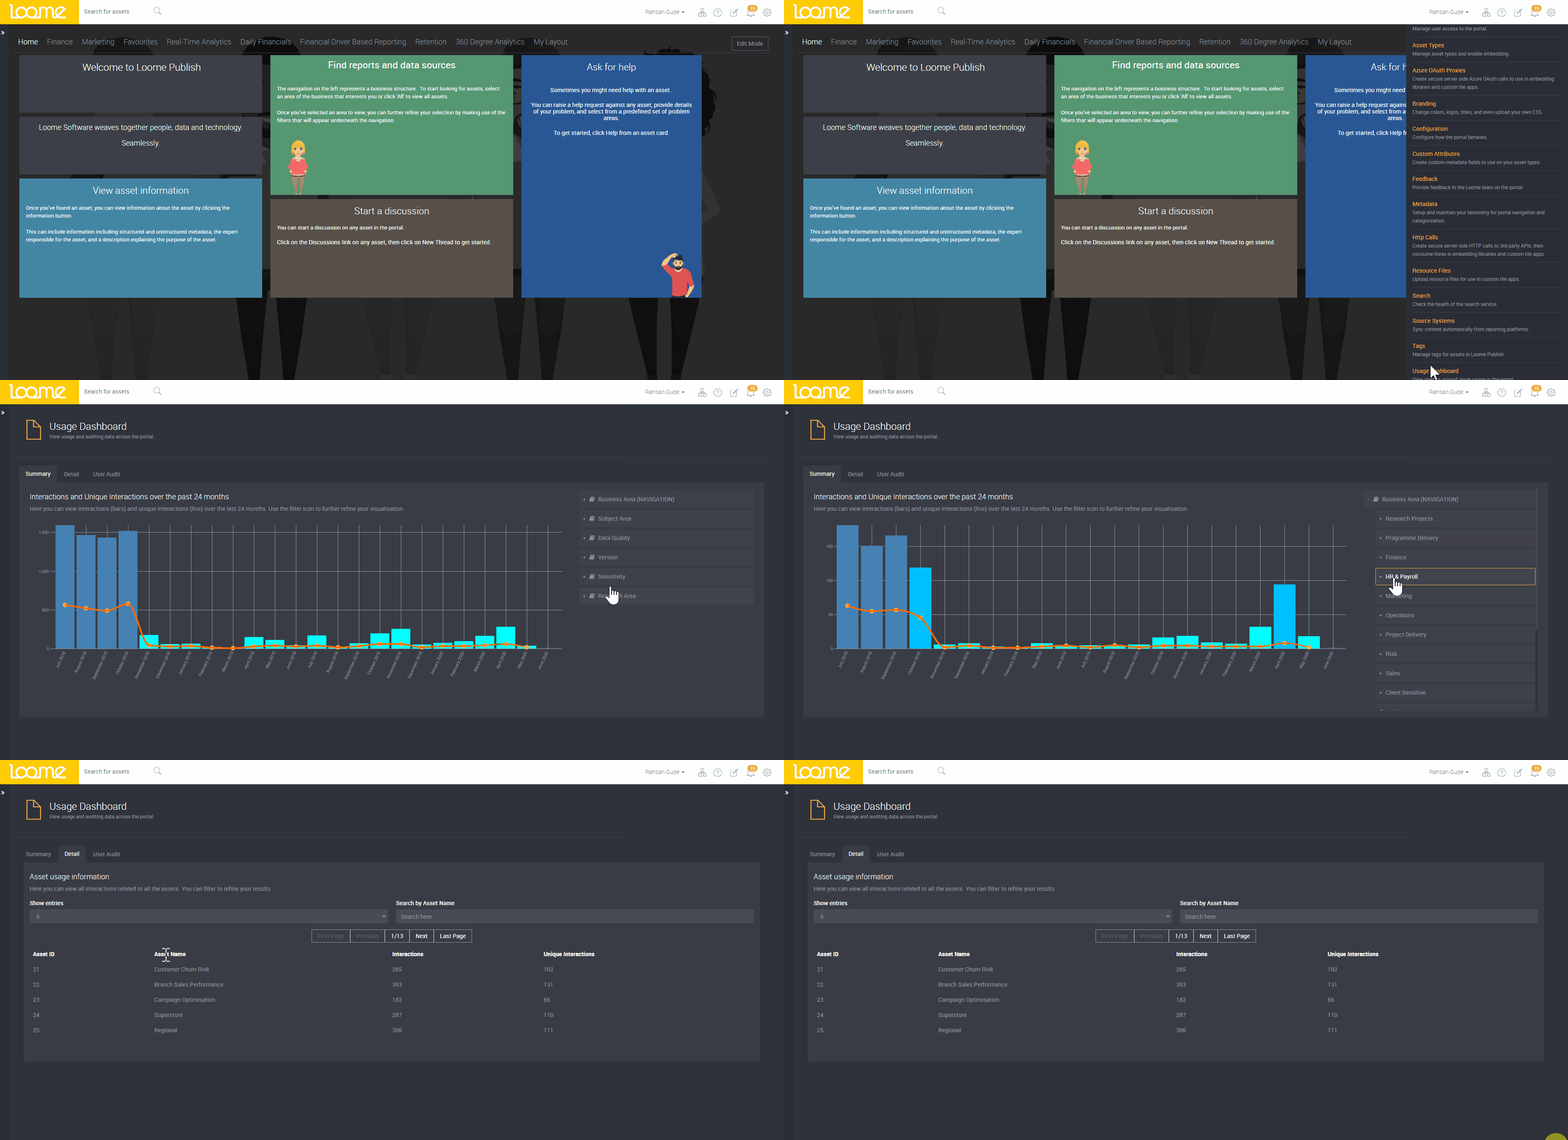
The Report Usage Analysis feature in Loome Publish allows Administrators to see exactly which assets in the report catalogue are being used, how often and by whom. The Usage Dashboard provides immediate insight to the number of interactions users have had with assets month on month, along with the total number of unique interactions across each asset. Drill through capabilities provide asset level and user level data, clearly demonstrating which reports (assets) are being used most frequently, and those which are not being used at all.
Remedial action can be taken on dormant reports, either by re-purposing or decommissioning where appropriate, allowing more effective management of an enterprise analytics portfolio.
