How it works
Before we start: Important terminology to remember
Loome Publish comprises of an Analytics (BI) Catalogue and a Data Catalogue. Reports and other analytics artefacts are referred to "assets" in the Analytics Catalogue, and "entities" in the Data Catalogue.
The Data Catalogue Network Map
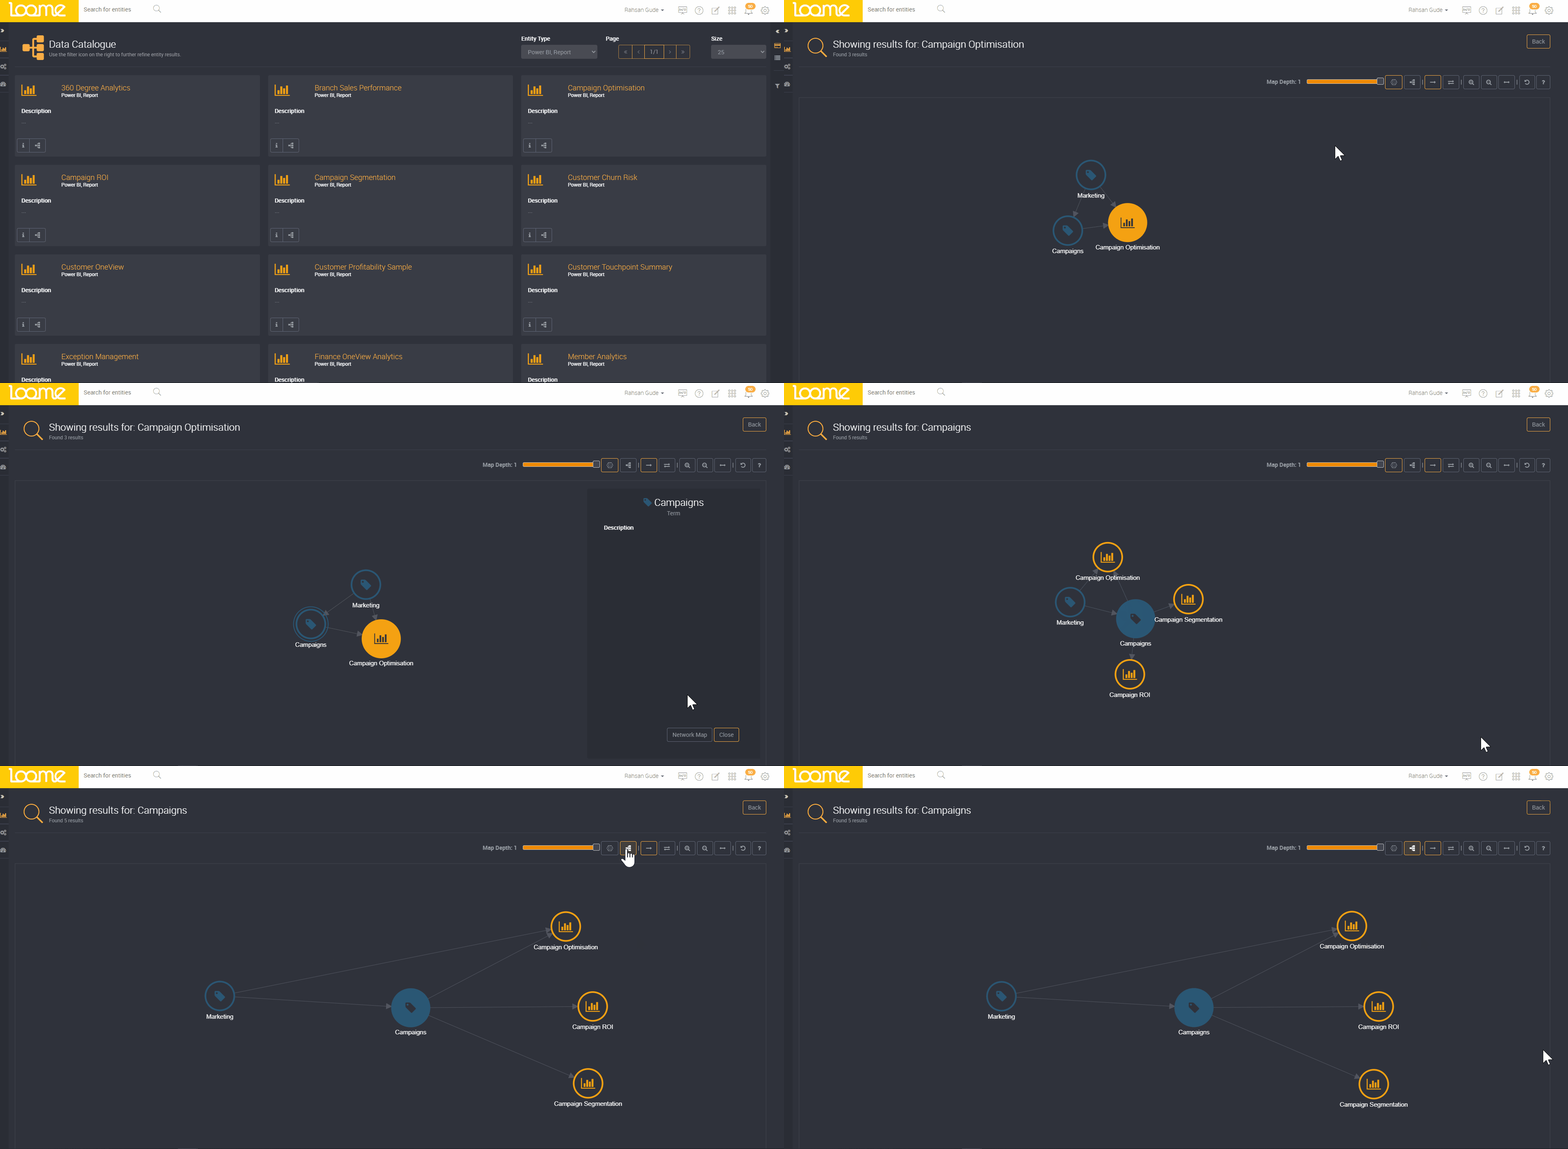
The unique Network Map allows you to view relationships between entities. The Network Map of a selected entity will map out all its connected entities with the option to display in Network Map View or Hierarchical Diagram view. The Hierarchical Diagram provides a structured view of your entities. This view helps to understand the actual flow and interactivity of the data.
In the example below, we search for an entity type "Power BI Report". We can see the interconnectivity of entities that contribute to the report "Campaign Optimisation".
By simply clicking on a related entity, in this case we select the attribute "campaigns" we can immediately see how this attribute is connected to an extende network of Power BI reports.
